
Introduction
Silicon carbide (SiC) power modules switch faster and run hotter than silicon, and the stack that carries the die decides how long they last. In a double-sided cooled card, a few hundred microns of copper, ceramic and sintered silver determine whether the attach fatigues first or the ceramic cracks first.
Finite element method (FEM) simulation captures these effects in detail, but each transient thermo-mechanical run takes minutes. Exploring hundreds of stack variants, finding the best trade-offs and checking them against manufacturing tolerances quickly becomes the bottleneck.
This post walks through a surrogate-driven study on Quanscient Allsolve that removes that bottleneck. We generated 300 FEM designs in one sweep, trained Gaussian-process surrogates on them, searched for the best designs with multi-objective optimization, and verified the results back in FEM. Every number reported as a design result is an FEM result; the surrogate only decides where to look.
The design challenge
The card is a symmetric stack: ceramic substrates, sintered-silver attaches, a SiC die, a copper spacer and coolant on both faces. The die is pulsed with 2 seconds of power followed by 2 seconds off, so the materials expand and contract at different rates on every cycle.
Two failure modes compete:
-
Attach fatigue. Cyclic deformation dissipates energy in the sintered-silver attach under the copper spacer. The energy dissipated per cycle is our damage indicator.
-
Ceramic fracture. Thermal mismatch creates tensile stress in the ceramic substrate, which can lead to cracking.
Improving one tends to worsen the other. Thicker copper protects the attach but loads the ceramic; thicker ceramic does the reverse.
The study had four free design variables: copper thickness, ceramic thickness, top attach thickness (up to a sinterable 50 µm) and the share of cooling on the top face. Three more were fixed by manufacturing. Every design also had to keep the die temperature rise within 100 K at rated power, die stress within 300 MPa, warpage within 5 µm and the total card thickness between 3.0 and 4.5 mm. That thickness budget is what turns the problem into a real design decision: every millimetre given to copper is taken from ceramic.
Building the physics-based FEM model
A reliable surrogate starts with a reliable physics model. We modelled one quarter of the card in 3D using two symmetry planes, with transient heat transfer, thermal expansion and elasticity, pulsed die loss, and convective cooling on both faces.
The sintered-silver attaches were modelled as viscoelastic solids using a Prony series. A recursive formulation keeps the stiffness matrix constant through the transient, so its factorization is reused across all 1,200 time steps. The model has about 106,000 degrees of freedom, converged to 2% against a 392,000-DOF model, and one three-cycle run takes about three minutes on a single 8-core node.
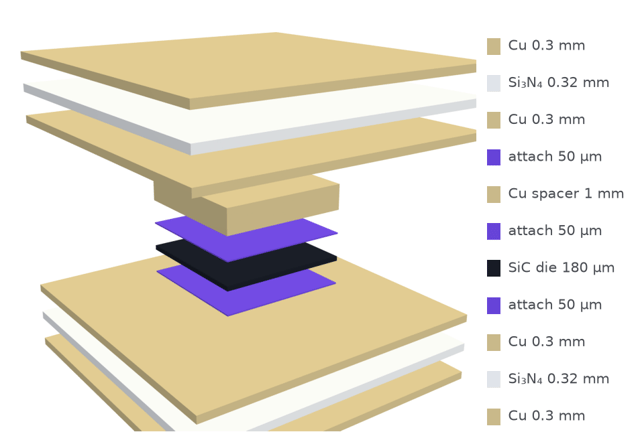
Figure 1. The simulated card: a 12 × 12 mm double-sided cooled stack with a 5 × 5 mm SiC die, shown exploded. One quarter is simulated using two symmetry planes.
One run gives the full picture. The die temperature settles within the first cycle, stress concentrates in the attaches and the ceramic while the die stays low, and the energy dissipated per cycle comes out of the same run because the viscoelastic branches carry the strain history.
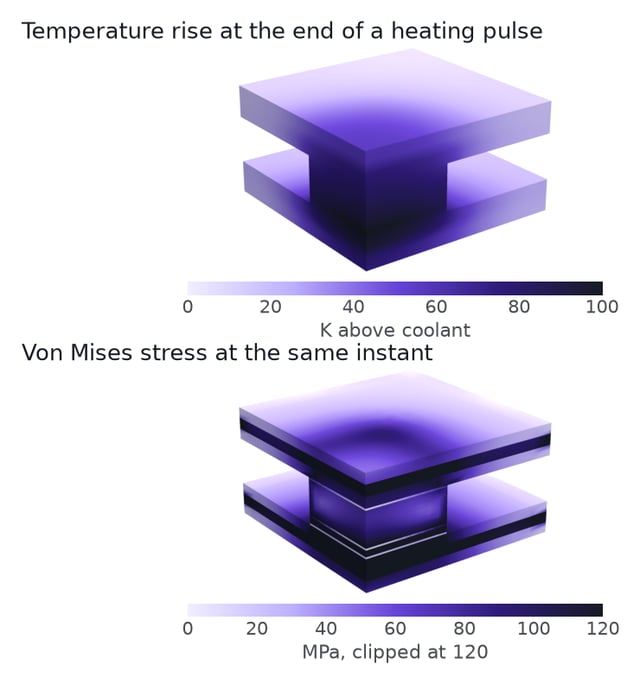
Figure 2. Temperature, stress and attach damage for the baseline design at 400 W, viewed from the symmetry planes.
Before any design runs, the custom viscoelastic formulation was checked against three analytical cases: creep under constant load, free thermal expansion and a clamped bar under thermal cycling. All agreed within 1%. The free-expansion case mattered most: a naive thermal coupling dissipates energy in a body that is free to expand, where the correct answer is zero, so that coupling was ruled out.
Quanscient Allsolve
Surrogate models on cloud-scale FEM
Generate training data as massively parallel sweeps and turn it into fast, verified surrogate models with Quanscient Allsolve.
Learn more about surrogate models in Quanscient Allsolve -->
Accelerating design exploration with surrogate models
We sampled 300 combinations of the seven model parameters with a Latin hypercube and submitted them as a single parameter sweep on Allsolve. The platform ran all of them at once on 2,411 cores.
300 FEM simulations | 402 seconds total sweep time | 7 sampled parameters
Every sample reached a periodic cycle to within 0.13%. We then trained a separate Gaussian-process (Kriging) model for each of the five outputs: attach energy, ceramic stress, die stress, die temperature and warpage. Once trained, a surrogate evaluates a new design almost instantly, which makes optimization and interactive exploration practical.
Accuracy was always measured on held-out designs that were not used for training. With 80 FEM samples, the error was 1.0% for attach energy and 0.8% for ceramic stress; with 150 samples, both dropped to 0.4%. A carefully sampled dataset of fewer than 100 FEM runs is enough for this design space, and the 300-sample set is three to four times larger than needed.
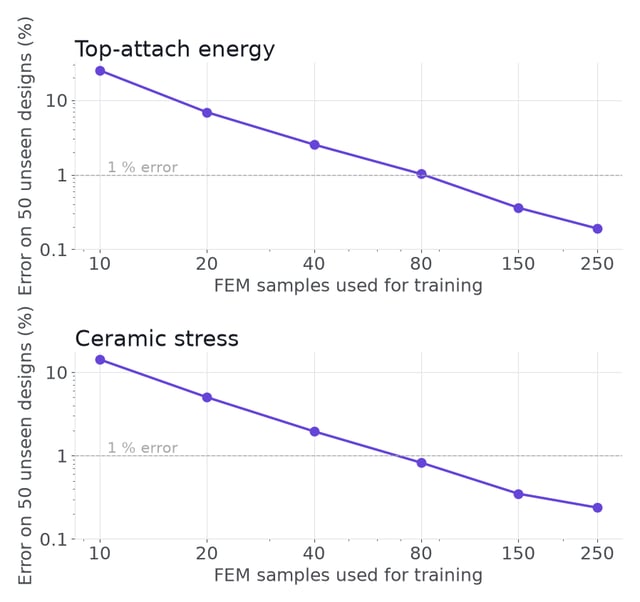
Figure 3. Surrogate error on 50 unseen designs as the training set grows, averaged over five random splits.
Identifying the most influential design parameters
Knowing what drives performance is as valuable as finding the optimum. Sobol sensitivity analysis on the surrogates showed that copper and ceramic thickness dominate both failure modes, in opposite directions.
-
Attach damage: copper thickness explains 61% of the variance and lowers it.
-
Ceramic stress: ceramic thickness explains 56% of the variance and lowers it, while the cooling split and copper thickness raise it.
-
Interactions: first-order effects explain 98% of the variance, so parameter interactions are small.
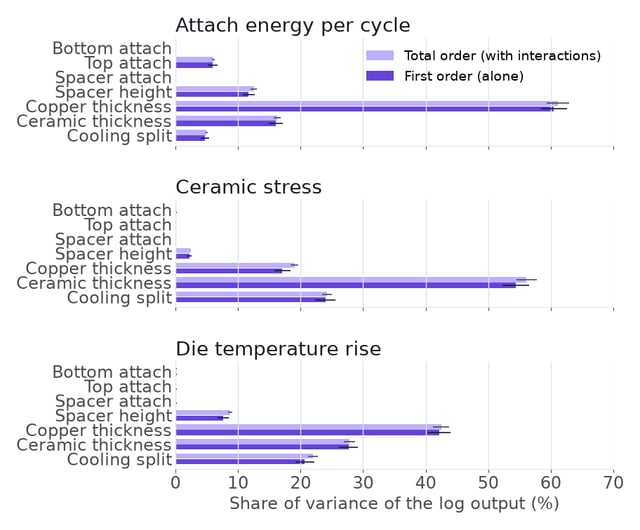
Figure 4. Sobol indices over the full design box. First- and total-order indices nearly coincide, confirming that interactions are small.
To make sure the ranking was not an artefact of the surrogate, we checked it directly in FEM with a Morris elementary-effects screening: 80 additional runs in one sweep, completed in 8 minutes. The FEM ranking matched the surrogate ranking exactly for both objectives, and the surrogate predicted those 80 unseen designs within 0.4%.
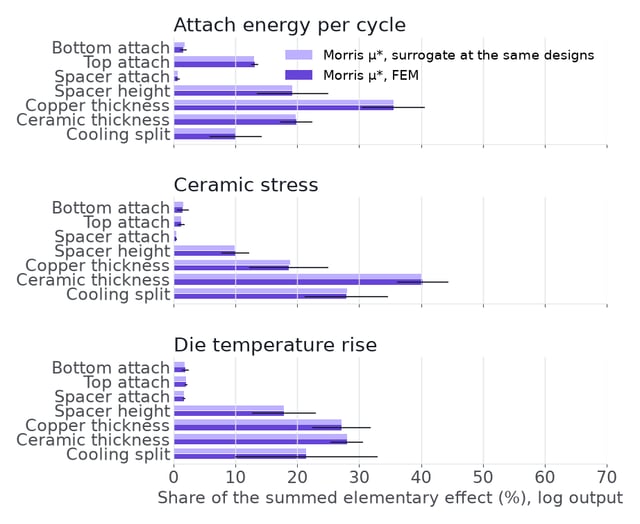
Figure 5. Morris screening, FEM against surrogate. Error bars on the FEM results are 95% intervals over ten trajectories.
Finding better designs with multi-objective optimization
With trusted surrogates in place, we used the NSGA-II algorithm to minimize two objectives at once: the energy dissipated per cycle in the attach under the spacer, and the peak tensile stress in the ceramic. Instead of a single answer, multi-objective optimization returns a Pareto front: designs where one objective can only improve if the other gets worse.
The thickness budget proved essential. Without it, the optimizer simply built a 6 mm card, adding material everywhere. That answer is correct but useless for a real package. With a budget, copper and ceramic have to share a fixed stack, and the front shows how best to allocate it.
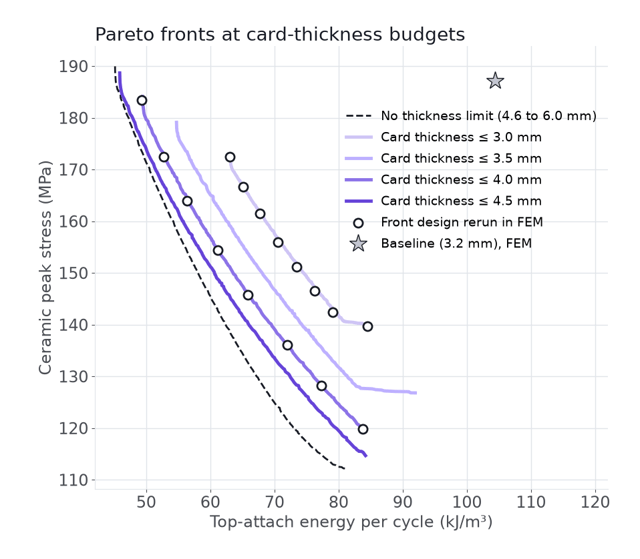
Figure 6. Pareto fronts at four thickness budgets.
The original 3.2 mm baseline sits on the temperature limit. The 3.0 mm front beats it on both reliability objectives while being thinner:
| Metric | Baseline | Optimized 3.0 mm front |
|---|---|---|
| Card thickness | 3.2 mm | 3.0 mm |
| Attach energy per cycle | 104 kJ/m³ | 63–85 kJ/m³ |
| Ceramic tensile stress | 187 MPa | 140–173 MPa |
| Die temperature rise | At the 100 K limit | Margin on most of the front |
Rather than adding material, the optimizer finds a better way to distribute it. The field plots make the difference visible. In the baseline, the dissipated energy concentrates at the die edge where the copper spacer pulls on the attach. A front design with thicker copper, a thinner and shorter spacer, a thicker top attach and more cooling on the bottom face cuts it from 104 to 51 kJ/m³.
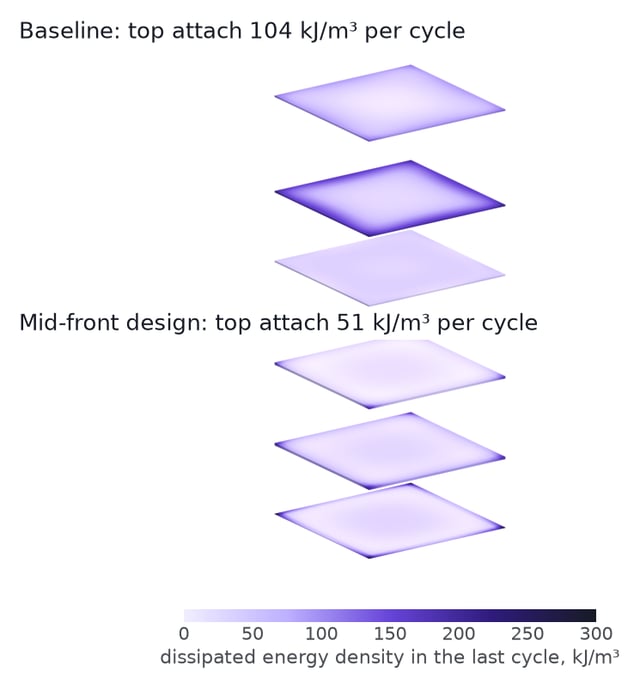
Figure 7. Last-cycle energy dissipation in the three attaches, baseline against a front design, on the same colour scale. Both designs were rerun in FEM with field output.
Exploring the design space interactively
Because the surrogates are fast, they can power interactive tools. We exported the trained Kriging models into a single standalone HTML file with no server and no libraries. Four sliders set the design, and the page shows the thickness budget, all five responses against their limits, and where the design sits relative to the Pareto fronts.
Engineers can answer questions like these in seconds instead of launching a new FEM run each time:
-
How much copper can be removed before the die temperature exceeds its limit?
-
How does a thicker ceramic shift the balance between the two failure modes?
-
What happens to warpage and temperature when the cooling split changes?
-
Which configuration gives the best compromise within a given thickness budget?
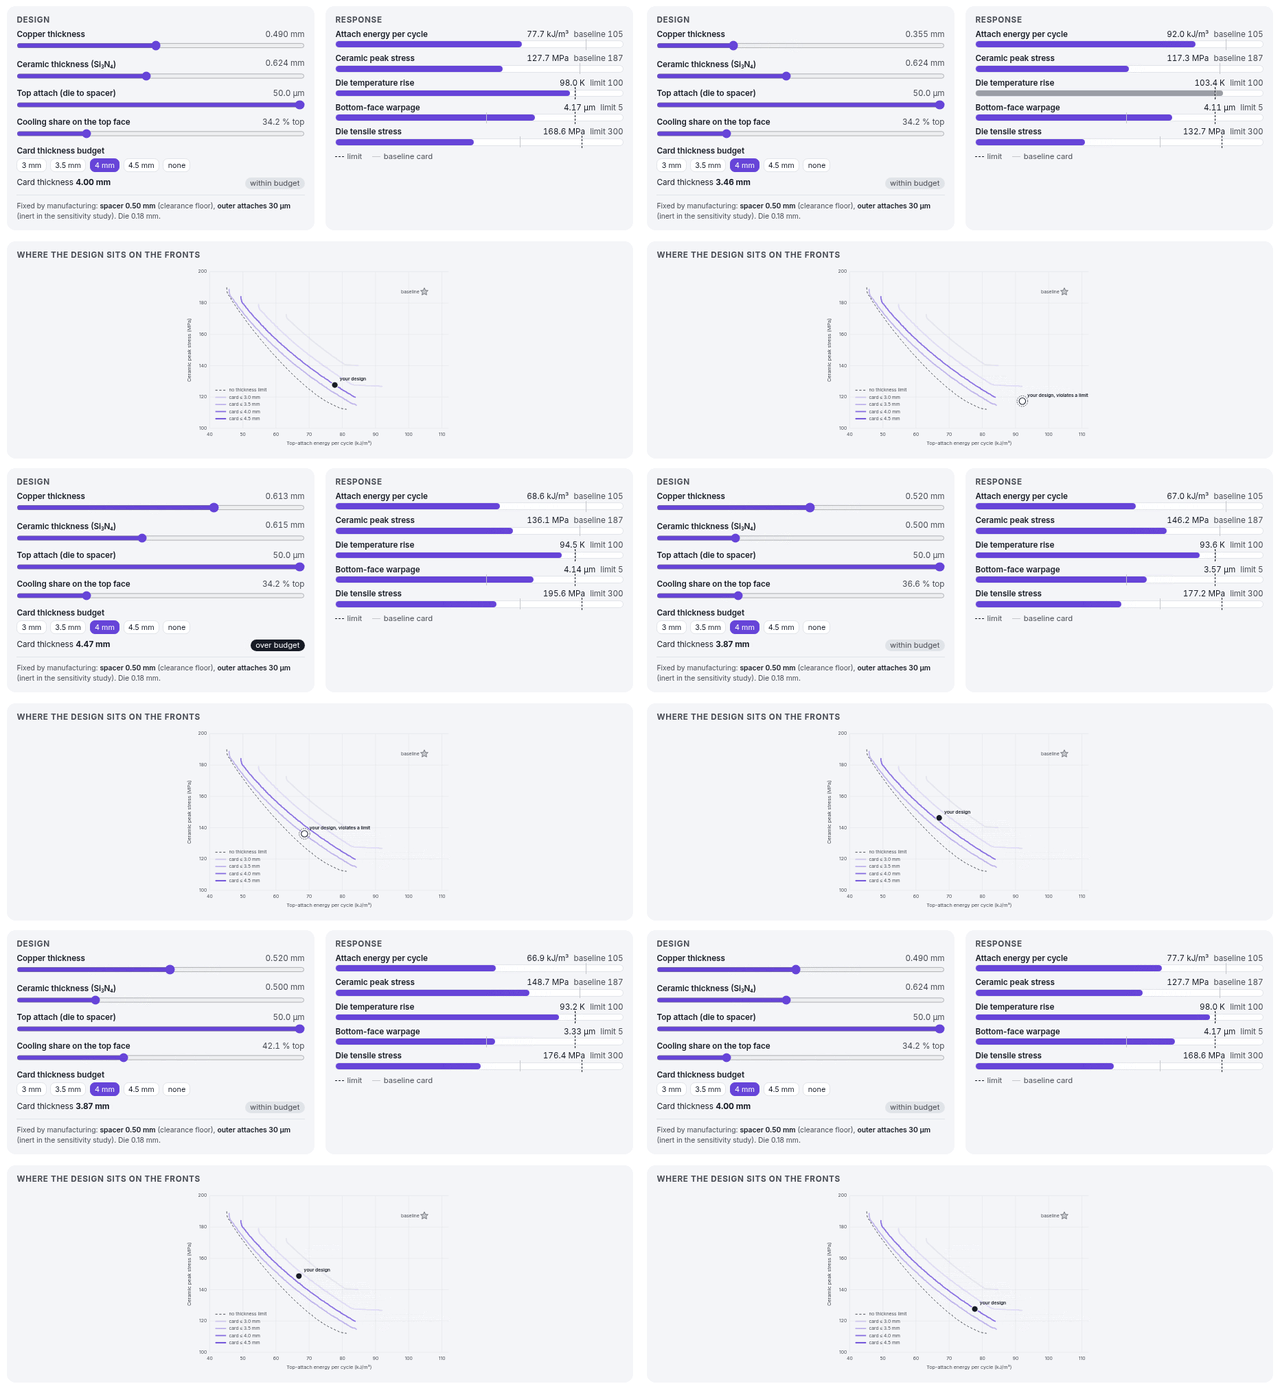
Figure 8. The design explorer in use: copper is reduced through the temperature limit, increased through the thickness budget, then ceramic thickness and cooling split are adjusted.
Every value in the explorer is a surrogate prediction inside the region that FEM has verified, so exploration stays within proven accuracy.
Closing the loop with FEM verification
Surrogates are for searching; FEM is for deciding. We took eight designs from each of the 3.0 mm and 4.0 mm Pareto fronts, none of which were in the training data, and reran them in the full FEM model as a single sweep that finished in five minutes.
The agreement was close. The mean error was 0.18% for attach energy and 0.10% for ceramic stress, with a maximum of 0.37%, and die temperature agreed within 0.05%. All sixteen designs met every constraint in FEM, with temperature as the only active limit at the hot end of each front.
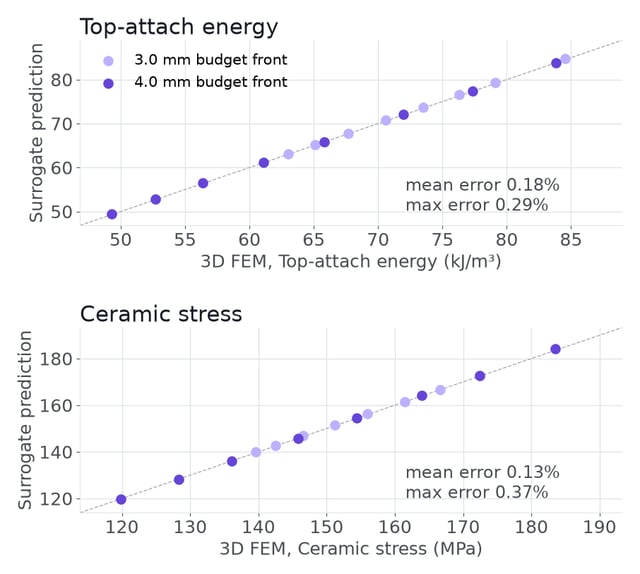
Figure 9. Surrogate prediction against FEM for the sixteen verified Pareto-front designs. The dashed line marks perfect agreement.
This is the core principle of the workflow: machine learning accelerates the search, and high-fidelity simulation provides the final verification. The surrogate does not replace FEM; it reduces the number of expensive runs needed to find designs worth verifying.
From nominal optimum to manufacturing yield
A design that is optimal on paper can still fail in production. Small variations in layer thickness or cooling shift the temperature and stress response, and a design sitting exactly on a limit has no room for them.
We ran a Monte Carlo analysis with 10,000 tolerance samples per design across all seven dimensions, evaluated through the surrogates for every design on the four fronts. The nominal optimum on each front had a predicted yield of only 48%, because it sits on the 100 K temperature limit; the baseline reached 37%.
A small margin changes that. Backing off to a nominal temperature rise of 98 K raised predicted yield to 99%, at the cost of about 5–7% higher ceramic stress than the nominal end of the front. A design that is slightly less impressive on paper is the better engineering choice when it consistently meets specification.
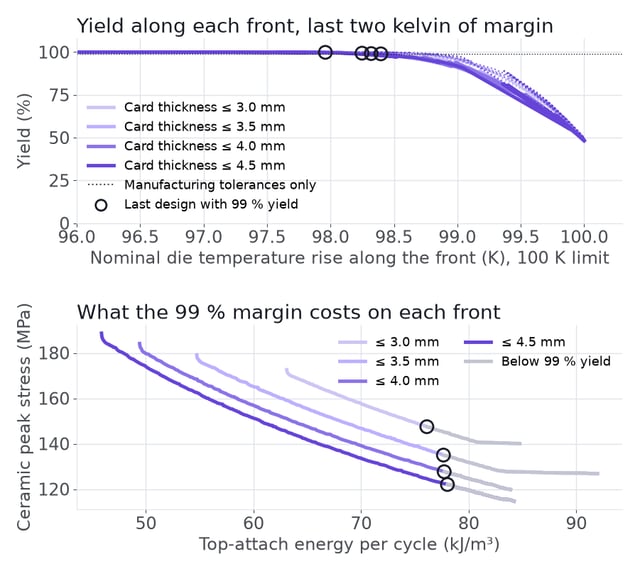
Figure 10. Yield along the fronts. Top: yield against nominal die temperature rise, with all tolerances (solid) and manufacturing tolerances only (dotted). Bottom: the fronts, greyed out where yield falls below 99%; circles mark the last design with 99% yield.
A random FEM subsample cannot confirm a 99% yield; fifty random runs cannot tell 99% from 97%. Instead, we placed 25 FEM runs where the distribution depends on the surrogate: at predicted quantiles, along the 100 K limit and across the tolerance cloud around the chosen 4.0 mm design. The quantile runs landed on the predicted curve within 0.01 K, and the measured error moved the yield estimate only to 99.87–99.89%.
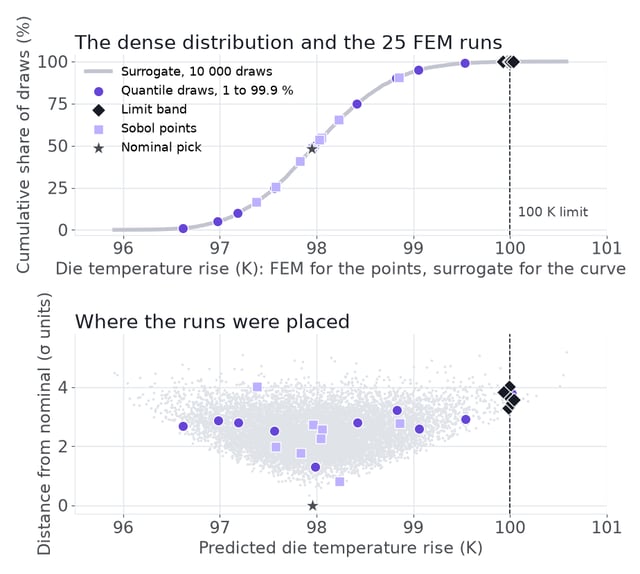
Figure 11. Targeted FEM runs on the surrogate yield distribution. Top: predicted cumulative distribution of die temperature rise with each FEM run at its quantile. Bottom: the runs within the tolerance cloud.
The yield figures depend on the assumed tolerance distributions. With production tolerance data, the same analysis gives a manufacturing forecast directly.
Conclusion
This power-card study shows how FEM simulation, surrogate modeling, sensitivity analysis and multi-objective optimization combine into a fast and credible design process. Three sweeps of the same Allsolve model did the heavy lifting: 300 runs to train, 16 to verify the front and 25 to validate the yield. In between, the surrogates searched the design space in seconds.
The result is not just a better nominal design, but a thinner card that outperforms the baseline on both failure modes, a quantified view of which parameters matter, and a design choice backed by a validated yield estimate.
The surrogate explores. FEM verifies. Together, they let engineers evaluate more alternatives and make better-informed decisions without giving up the rigor of high-fidelity simulation.